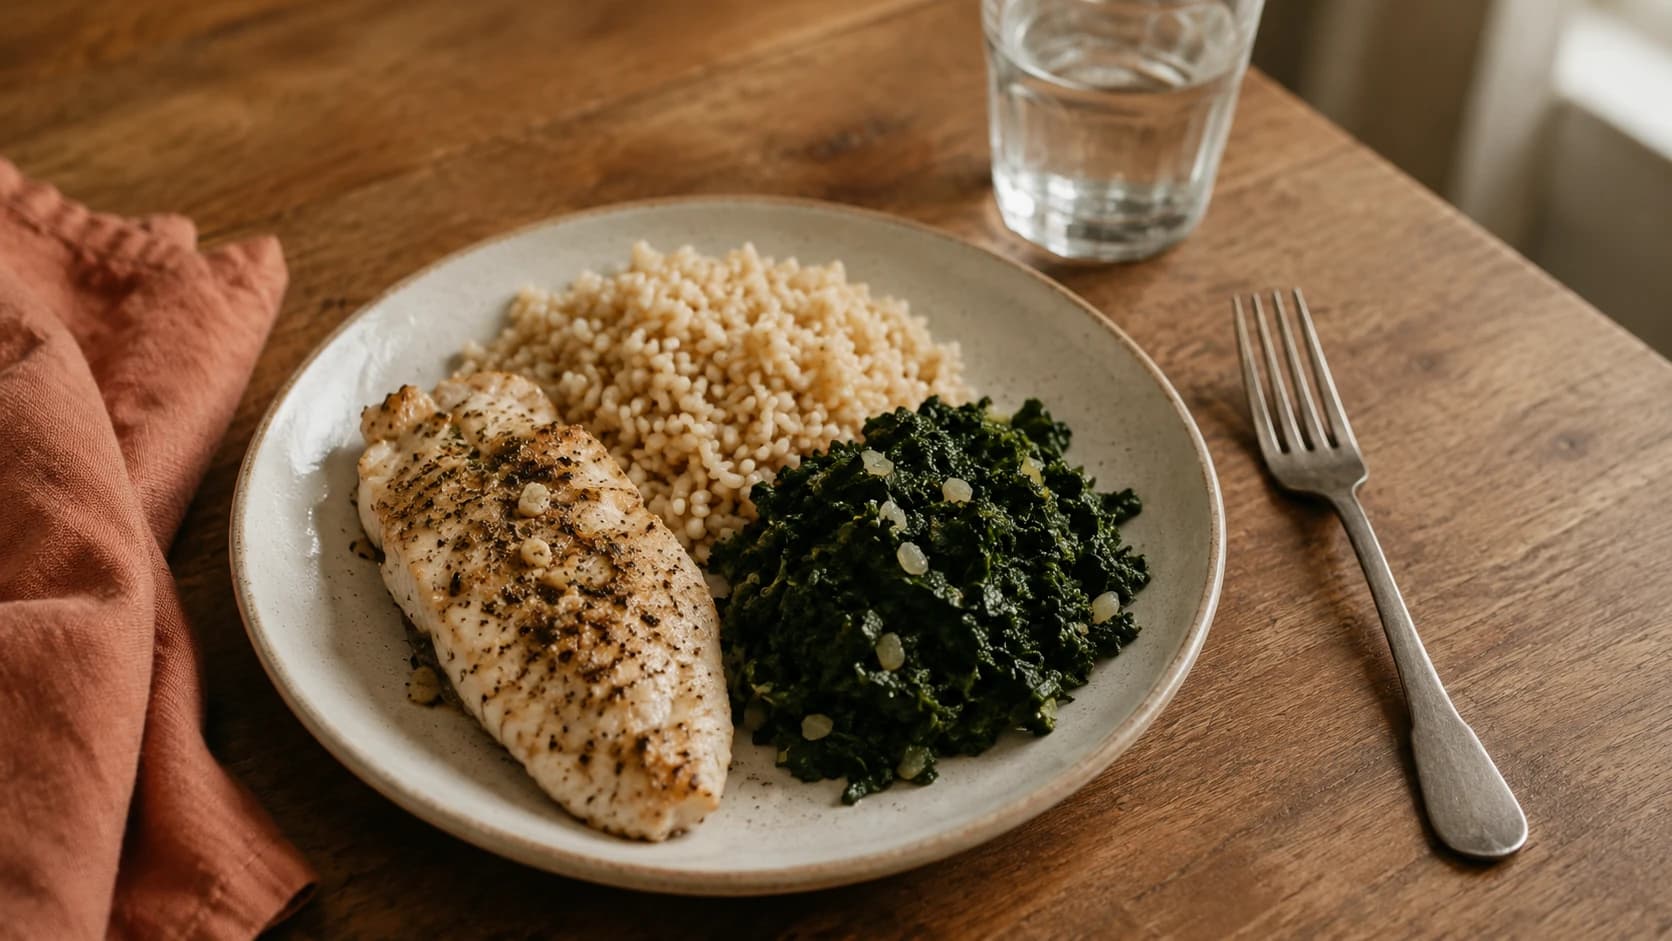

Quick answer: In the largest study to measure this with body scans rather than a scale, the rate of total weight gain did not change when women entered the menopause transition — in the paper's own words, "there is no discernable change in rate of weight gain at the start of the MT." What changed was what the weight was made of: fat mass gain roughly doubled, from 1.0% to 1.7% a year, while lean mass flipped from a small annual gain to a small annual loss.
If your clothes fit differently while the number on the scale looks much as it always did, you are noticing something real. The scale is a poor instrument for it — it reports one total and cannot say which tissue that total is made of. The National Institute on Aging puts it plainly: during the menopausal transition "the body begins to use energy differently. The distribution of fat in the body changes," and "You could lose muscle and gain fat" (NIA).
What actually changes (and what doesn't)
The Study of Women's Health Across the Nation (SWAN) followed 1,246 women with repeated dual energy X-ray absorptiometry (DXA) scans from 1996–1997 through 2011–2013. DXA separates fat mass from lean mass; a scale reports only their sum. That distinction is the whole finding (Greendale et al., 2019).
| What was measured | Before the transition | During the transition |
|---|---|---|
| Fat mass | +1.0% a year (0.25 kg) | +1.7% a year (0.45 kg) |
| Lean mass | +0.2% a year | −0.2% a year |
| Fat and lean mass combined | +0.32 kg a year | +0.40 kg a year |
| Rate of total weight gain | — | No discernible change |
The paper states the weight result twice, and precisely. "The rate of increase in the sum of fat mass and lean mass is 0.32 kg per year in premenopause and 0.40 kg per year during the MT. This is not a discernable change in rate." And, statistically: "weight and BMI slopes at the onset of MT did not differ statistically from slopes during premenopause (P = 0.98 for change in weight slope)." A p-value of 0.98 is about as flat as this kind of analysis gets.

Both things are true at once. Weight kept climbing at the rate it already had, and underneath that unchanged total, fat accumulated roughly twice as fast while muscle went the other way. Two different bodies can produce the same reading — which is why being told the number looks fine can feel at odds with what you are seeing.
The timeline: when it starts and when it stops
The changes are anchored to the final menstrual period rather than to a birthday. In the same analysis, fat and lean mass measures began shifting about 2 years before the final period and decelerated about 1.5 years after it, reaching a zero slope somewhere between 1.5 and 10.5 years afterwards. On weight itself, the authors write: "Weight climbed linearly during premenopause without acceleration at the MT. Its trajectory became flat after the MT" (Greendale et al., 2019).
That is a defined window of roughly three to four years, not an indefinite decline — which almost nothing written on this subject bothers to say.
Working out where you are in it is harder, since the final period is only identifiable in hindsight. The average age at menopause in the United States is 52 (NIA) — 51 is also widely quoted, from older datasets — a discrepancy covered in when perimenopause starts. And under STRAW+10, perimenopause does not end at your last period; it includes the 12 months after it (Harlow et al., 2012), as explained in what perimenopause actually is. Body composition and the transition run on two different clocks.
Why "menopause makes you gain weight" is the wrong explanation
It is the standard line, and it does not match what the scans measured. Weight was already climbing before the transition — about 0.32 kg a year — and kept climbing at a statistically indistinguishable rate through it. What the transition was associated with was not a faster total, but a change in what that total consisted of, and in where the fat sat.
This distinction matters practically, because the two explanations point at different responses. "Hormones are making you gain weight" points at eating less. "Fat is accumulating faster while muscle is being lost" points at defending muscle. Only one of those is what the measurement actually found.
It would be just as wrong to overcorrect. This is one cohort study, and it does not show that hormones have no bearing on weight in any population. What it shows is what happened in 1,246 women in a US, community-based rather than population-based sample drawn from five of SWAN's seven sites, without direct examination of hormone trajectories. It is the best measurement of this question we could verify — not the last word on every question nearby.
Belly fat and where the weight goes
That analysis could not address where the fat went — the authors say they "were unable to consider the effect of the MT on regional body composition and visceral fat." The same group answered it later, in 380 women with regional DXA measurements followed for a median of 11.8 years (Greendale et al., 2021).
| Fat depot | Premenopause | During the transition | After menopause |
|---|---|---|---|
| Android (abdominal) | +1.21% a year | +5.54% a year | +0.90% a year |
| Visceral | No increase | +6.24% a year | +1.47% a year |
| Gynoid (hip and thigh) | No increase | +2.03% a year | −0.87% a year |
| Waist girth | +0.55% a year | +0.96% a year | +0.55% a year |
Visceral and gynoid fat began increasing at the transition; android fat, already rising, accelerated more than fourfold. This is also the better-evidenced explanation for a midsection change in midlife than the stress-hormone story sold as cortisol belly, which rests on far weaker ground than the DXA trajectories here. The authors' conclusion is direct: "The MT is associated with the development of central adiposity. Waist or hip circumferences are less sensitive to changes in fat distribution." Read that second sentence twice — waist girth grew at rates not statistically different across the three stages, even while the scan showed visceral fat rising sharply. The tape measure is as blunt an instrument here as the scale.
Two caveats: these are the White referent figures, and the authors found significant differences in some trajectories among Black and Japanese participants; and 380 women is a much smaller sample than the 1,246 above.
There is a reason to care beyond appearance, and it needs no alarm. The same window is when SWAN recorded a distinct shift in blood lipids: among 1,054 women, "only total cholesterol, LDL-C, and apolipoprotein-B demonstrated substantial increases within the 1 year interval before and after FMP" — tied to the transition rather than to ageing — leading the authors to conclude that "monitoring lipids in perimenopausal women should enhance primary prevention of CHD" (Matthews et al., 2009). This is the stage where a lipid panel starts to carry information; normal cholesterol levels by age covers how to read one.
What this changes about what to do
One honest limitation first: SWAN describes what happened to a group of women over time. It tested no intervention, so it cannot tell you what prevents or reverses these changes, and nothing below should be read as evidence that it does.
What the mechanism supports is a change of target: if lean mass is what shifts from slow gain to slow loss, preserving it is the goal. A strategy judged only by the scale cannot distinguish fat lost from muscle lost — precisely the distinction that matters.
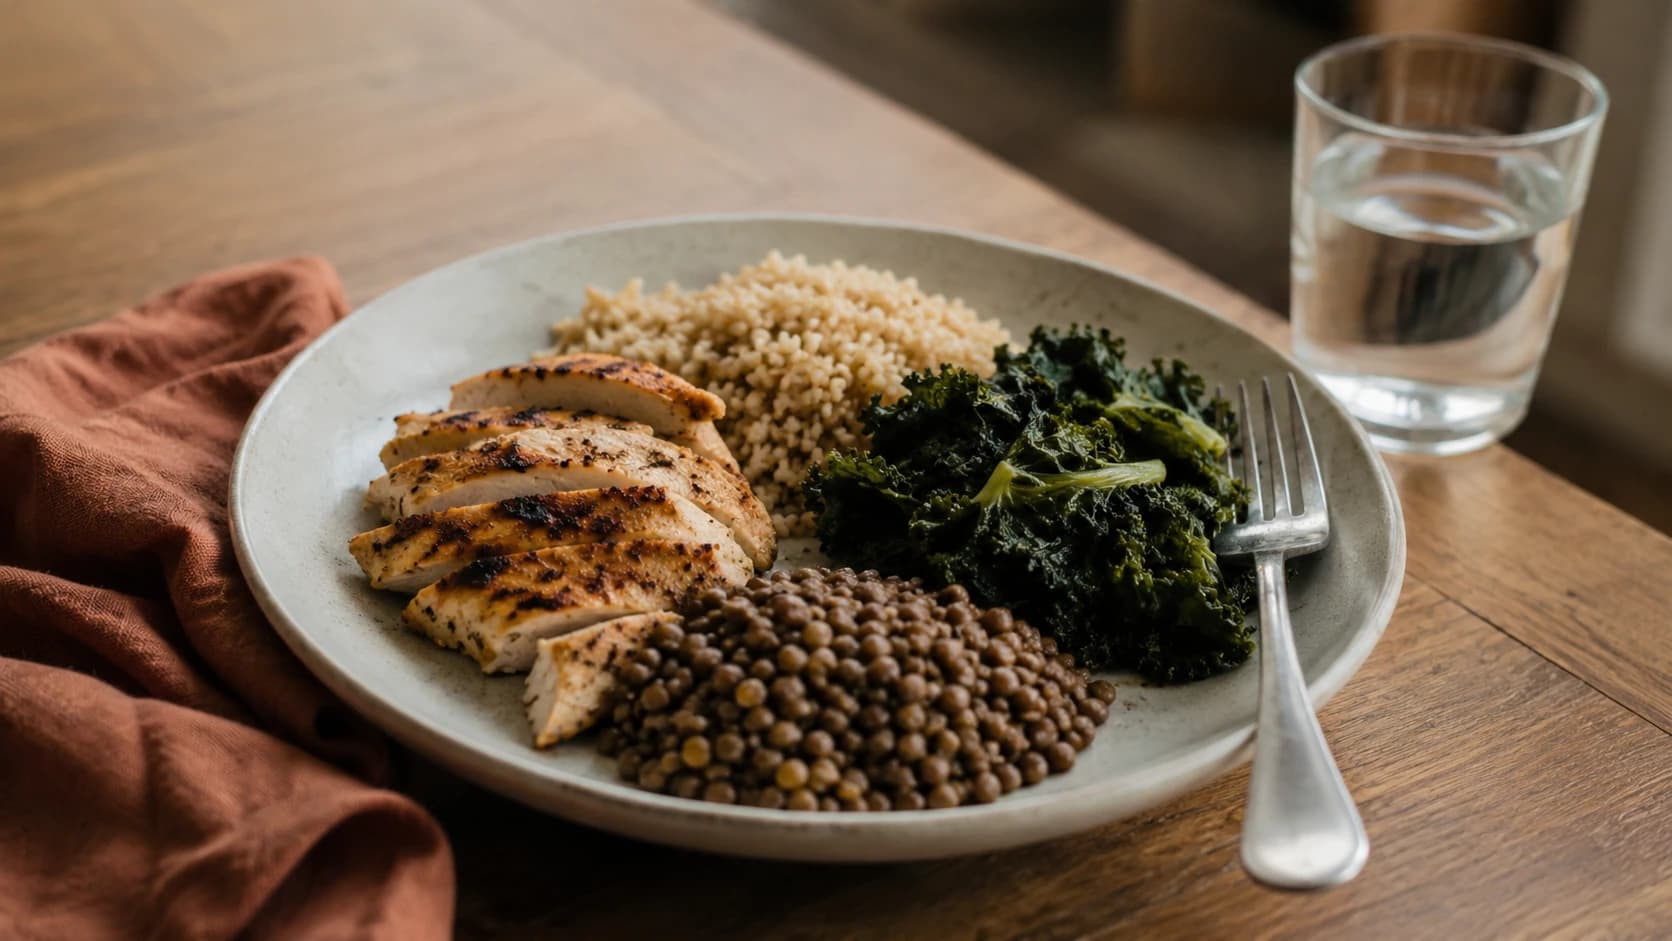
On protein, this page gives you the floor and not a target. The adult Recommended Dietary Allowance is 0.8 g per kilogram of body weight, or 46 g a day for women (DRI summary tables). Higher intakes exist but were set for a different population — PROT-AGE advises 1.0 to 1.2 g/kg for people over 65 (Bauer et al., 2013) — and women in their forties are not that group. We could not verify a protein target set specifically for the menopause transition, so we publish none; our perimenopause diet guide works through it in detail.
The same discipline applies to resistance training. No trial we could verify has tested a training prescription for preserving lean mass through the transition specifically. What exists is general adult guidance: "Adults should also do muscle-strengthening activities of moderate or greater intensity and that involve all major muscle groups on 2 or more days a week" (Physical Activity Guidelines for Americans, 2018) — population-wide advice, not a menopause-specific prescription.
One point needs care, because it is easy to misread. Exercise appears on The Menopause Society's not recommended list at Level II — a verdict about treating hot flashes and night sweats, the only outcome that panel assessed (The Menopause Society, 2023). It is not a finding that exercise is useless in perimenopause. The statement did not evaluate it for lean mass, bone density, cardiovascular risk, mood or sleep, which is where the reasons to do it actually come from.
Does weight loss help symptoms?
Yes, with a qualified grade — and it is one of the few lifestyle interventions here that gets an affirmative recommendation at all. The Menopause Society's 2023 statement concludes: "The limited available evidence suggests that weight loss may be used to improve VMS for some women. (Levels II-III; recommended)" (The Menopause Society, 2023). Levels II-III means limited or inconsistent evidence plus expert opinion — not the Level I grade carried by cognitive behavioural therapy, SSRIs and gabapentin — and the panel notes that the supporting studies "are either small pilot studies, nonrandomized trials, or post hoc analyses of studies designed for a different purpose."
The timing detail is the useful part. Adiposity acts as a risk factor for vasomotor symptoms "earlier in the transition (perimenopause and early postmenopause) but not when women are older or later in the transition," so weight loss may do more earlier in it. That is a finding about symptom relief for women who want it, not a statement about how anyone should look. Where it sits among better-evidenced options is covered in perimenopause treatment options.
What the evidence doesn't support
We found no verified evidence that any supplement prevents or reverses the body-composition changes described on this page. That is a statement about an absence and should be read as one: we did not locate credible trials testing the question — not that evidence exists showing supplements fail at it.
Separately, The Menopause Society does not recommend supplements or herbal remedies for vasomotor symptoms at Levels I-II — again a verdict about hot flashes and night sweats, not about body composition, which the statement did not assess. Our supplements guide covers the individual products and what each was tested against — the question worth asking of anything sold for "menopause belly."
Frequently asked questions about perimenopause weight gain (FAQ)
Why am I gaining weight in perimenopause? In SWAN's study of 1,246 women, the rate of total weight gain did not measurably speed up at the start of the menopause transition — women were already gaining steadily beforehand. What changed was composition: fat gain roughly doubled from 1.0% to 1.7% a year, while lean mass went from +0.2% to −0.2% a year. The same reading on the scale, a different body underneath it.
Does perimenopause cause belly fat? A SWAN analysis of 380 women found visceral fat began increasing at the menopause transition, at 6.24% a year, while android (abdominal) fat accelerated from 1.21% to 5.54% a year. Waist circumference grew at rates not statistically different across the stages, so a tape measure detects it poorly compared with a scan.
When does perimenopause weight gain stop? The changes SWAN measured began about 2 years before the final menstrual period and decelerated about 1.5 years after it, with the weight trajectory becoming flat afterwards — a defined window rather than an open-ended decline. These are cohort averages, not a schedule any individual will follow exactly.
Can I prevent perimenopause weight gain? The SWAN data cannot answer that: it describes what happened in a cohort rather than testing any intervention. The mechanism it identified — lean mass shifting from gain to loss while fat accumulates faster — points toward protecting muscle rather than eating less alone, but no trial we could verify has tested whether that prevents the change.
Does hormone therapy help with weight gain? A Cochrane review of 28 randomised trials in 28,559 women found no significant effect of hormone therapy on body weight: 0.03 kg for unopposed oestrogen and 0.04 kg for combined therapy. It neither causes nor prevents the weight gain of this stage. That review dates from January 2000 and had insufficient data to assess fat distribution, so it does not answer the composition question.
Medical disclaimer: This article is for informational purposes only. Always consult a qualified healthcare provider before making changes to your health routine.
Sources
- Greendale GA, Sternfeld B, Huang M, et al. Changes in body composition and weight during the menopause transition. JCI Insight 2019;4(5):e124865 — Peer-reviewed longitudinal cohort analysis (SWAN). https://insight.jci.org/articles/view/124865
- Greendale GA, Han W, Finkelstein JS, et al. Changes in Regional Fat Distribution and Anthropometric Measures Across the Menopause Transition. The Journal of Clinical Endocrinology & Metabolism 2021;106(9):2520-2534 — Peer-reviewed longitudinal cohort analysis (SWAN). https://pubmed.ncbi.nlm.nih.gov/34061966/
- National Institute on Aging. What Is Menopause? — US federal institute health information page. https://www.nia.nih.gov/health/menopause/what-menopause
- The North American Menopause Society. The 2023 nonhormone therapy position statement of The North American Menopause Society. Menopause 2023;30(6):573-590 — Clinical position statement (PDF). https://menopause.org/wp-content/uploads/professional/2023-nonhormone-therapy-position-statement.pdf
- Matthews KA, Crawford SL, Chae CU, et al. Are changes in cardiovascular disease risk factors in midlife women due to chronological aging or to the menopausal transition? Journal of the American College of Cardiology 2009;54(25):2366-2373 — Peer-reviewed longitudinal cohort analysis (SWAN), via PMC. https://pmc.ncbi.nlm.nih.gov/articles/PMC2856606/
- Kongnyuy EJ, Norman RJ, Flight IHK, Rees MC. Oestrogen and progestogen hormone replacement therapy for peri-menopausal and post-menopausal women: weight and body fat distribution. Cochrane Database of Systematic Reviews, 24 January 2000 — Systematic review and meta-analysis. https://www.cochrane.org/evidence/CD001018_hormone-replacement-therapy-has-no-effect-body-weight-and-cannot-prevent-weight-gain-menopause
- Office of Disease Prevention and Health Promotion, US Department of Health and Human Services. Physical Activity Guidelines for Americans, 2nd edition, 2018 — Federal guideline (PDF). https://odphp.health.gov/sites/default/files/2019-09/Physical_Activity_Guidelines_2nd_edition.pdf
- Food and Nutrition Board, Institute of Medicine, National Academies. Dietary Reference Intakes: Recommended Dietary Allowances and Adequate Intakes, Total Water and Macronutrients — Summary table via NCBI Bookshelf. https://www.ncbi.nlm.nih.gov/books/NBK56068/table/summarytables.t4/
- Bauer J, Biolo G, Cederholm T, et al. Evidence-based recommendations for optimal dietary protein intake in older people: a position paper from the PROT-AGE Study Group. Journal of the American Medical Directors Association 2013;14(8):542-559 — Expert group position paper. https://pubmed.ncbi.nlm.nih.gov/23867520/
- Harlow SD, Gass M, Hall JE, et al. Executive summary of the Stages of Reproductive Aging Workshop +10: addressing the unfinished agenda of staging reproductive aging. 2012 — Consensus staging criteria, via PMC. https://pmc.ncbi.nlm.nih.gov/articles/PMC3340903/
All sources accessed 6 August 2026.

Olivia Smith, RDN
A registered dietitian who cares what the scan measured, not just what the scale said.